Our site is customized by location. Please select the region of your service and we’ll remember your selection for next time.
Select a region for customized content and rates
Looks like you're in Canada
Looks like you're in the United States
Select a region for customized content and rates
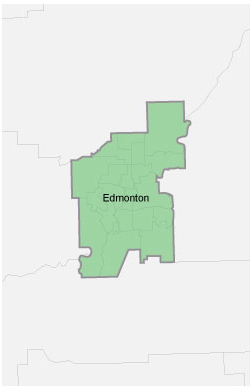
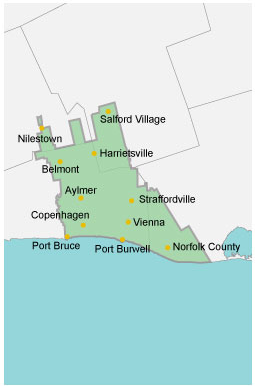
We're on track to eliminate PCBs (polychlorinated biphenyls) above 50 ppm concentration from our Edmonton and Southwest Ontario electrical systems by 2025, in accordance with Environment Canada's PCB Regulations.
The elimination of PCBs from its electrical infrastructure is being prioritized based on testing data and proximity to water bodies and environmentally sensitive areas. By 2010, our PCB testing program had facilitated the removal of most PCB-containing assets above 50 ppm from Edmonton's system. We are currently testing the remaining assets with unknown PCB content.
In 2021, we targeted over 1,550 pieces of equipment for review. By year's end, we had completed testing on 838 assets. Only one returned a PCB concentration at a level requiring decommissioning, which was managed in accordance with environmental regulations. Testing of assets, in Ontario will be complete in 2022, with removal from the system taking place as required. Any additional assets in Edmonton requiring decommissioning will be completed by 2023.
In addition to this review, there are pieces of equipment already slated for decommissioning and others that are tested through routine operations. The operation of equipment containing PCBs less than 50 ppm concentration will continue to be diligently managed in accordance with environmental regulations and bylaws as we continue to move forward with our PCB management plans.
Our fleet management system, first implemented in our Edmonton electricity business in 2015, provides real-time data on vehicle location, driver behaviour, and vehicle diagnostics for our Electricity, Water and Drainage fleets. It allows us to continuously improve the routing of dispatched crews and vehicles, optimize vehicle maintenance and reinforce efficiency-focused driving habits.
These improvements, alongside initiatives such as our anti-idling policy, have contributed to a fuel use reduction of more than 200,000 litres per year within our Electricity fleet since 2015. Further efficiencies were achieved through the adoption of electronic fleet management within the U.S. vehicle fleet in 2017.
As part of protecting the water quality of the North Saskatchewan River, we are dedicated to monitoring what flows into it. In our sustainability report, we report on one of the ways we protect water quality in the North Saskatchewan River. The 'total loadings' measure quantifies the annual mass of solids carried into the river as it runs off the land, and from three sources: the stormwater system, combined sewer overflows, and the wastewater treatment plant. The objective is to keep the volume of solids entering the river stable, even as our community grows.
Our approach is to consistently evaluate our performance goals and update them as our knowledge increases. A decade old, this legacy measure is currently under review between us and our regulator and due to the timing of approvals the new measure is still to be finalized. We expect future ESG reports to include updated targets that cover a wider range of discharge sources (including our water treatment plants). Future targets may also vary based on river water flow conditions, reflecting the regulator's pilot load apportionment framework and that the river's capacity to absorb solids is diminished during low-volume periods.
The largest source of solids loading to the river (90%) occurs through stormwater system discharges, which includes snow melt and rainwater runoff from urban areas. This runoff drains through the stormwater collection system, and the water picks up particles that impact the quality of water downstream.
Historically, the volume of solids delivered to the river by the stormwater system has varied seasonally and annually based mainly on the volume and intensity of rainfall and snow melt – which is reflected in the data reported for 2017 to 2020 (2021 data is currently being finalized and will be reported on in the 2022 ESG report).
During heavy rain events or accelerated snowmelt, there are two additional sources of solids discharged to the river. At the Gold Bar Wastewater Treatment Plant, high flows are managed by diverting some partially-treated water to the river. This accounts for about 18% of reported solids loading.
Additionally, if the capacity of the combined sewer system to transport wastewater is exceeded, the system is designed to overflow to receiving water bodies in order to prevent sewer backups into buildings. In both cases, the high water flows (which is primarily rain water) also serve to dilute discharges into the river and increase overall river volume, which helps protect waterways.
Edmonton's drainage utility transferred to EPCOR's ownership in September 2017, and along with it came accountability for addressing solids loading to the river from the stormwater and sewer systems.
We subsequently developed our Stormwater Integrated Resource Plan (SIRP), which includes more than $900 million in planned investments over 20-years to reduce peak stormwater flows through the use of dry ponds and Low Impact Development, both of which collect and store water during large rainfall events and accelerated snow melt. These investments build on the earlier Combined Sewer Overflow (CSO) control strategy.
These investments will reduce the risk of flooding, increase capacity in the combined sewer system, and filter stormwater before it reaches the river – improving the quality of stormwater entering the river, limiting the occurrence of CSOs, and reducing urban creek erosion.
Through increased monitoring, research, and modelling, we can quantify the sources for the loadings and then manage total loadings from our stormwater and sewage collection system.
The management of total loadings to the river is one aspect of a much broader Integrated Watershed Management Program. The program includes each of EPCOR's water-cycle utilities in Edmonton, and is designed to consider the entire watershed's health, ensure source water protection for the Edmonton water supply, and protect urban creeks and streams from erosion and loss of aquatic habitat.
Maximizing water resources in the Southwestern U.S. takes innovative approaches and dedication to reaching ambitious targets.
2021 saw significant progress on increasing the amount of treated effluent reused or used to recharge aquifers. This was primarily due to treatment capacity expansion, as well as the acquisition of four Arizona-based water reclamation facilities.
Learn how creativity and community collabouration created one of North America's most unique parks, and the essential services that are at play below the surface.
In early 2021, EPCOR finalized acquisition of the San Tan water and wastewater districts, located just southeast of the greater metropolitan Phoenix area. The fast-growing 160-square-mile service area already supports more than 32,000 water customers and nearly 40,000 wastewater customers in the communities of Florence, Queen Creek and unincorporated San Tan Valley in Pinal County.
Immediately after the acquisition, EPCOR began construction to expand capacity of the Pecan Water Reclamation Facility. The $21-million U.S. project will increase the facility’s capacity by 1 million U.S. gallons per day and replace poorly maintained parts of the facility where the wastewater treatment process begins, ensuring system reliability for existing customers and helping meet future water needs. The project started in March of 2021 and was completed during the same month of 2022, bringing the facility’s treatment capacity to a total of four million gallons per day.
Water treated by the plant is used by area farmers to irrigate the land, promoting water conservation efforts while serving a rapidly growing area in the southwestern U.S. Moreover, the project is another contributor to EPCOR’s goal of recharging at least 90% of the wastewater collected and treated in the area. As of mid-2021, the total amount of wastewater recycled/ recharged by EPCOR for reuse in Arizona exceeded 18 billion gallons.
The Luke 303 Water Reclamation Facility in Phoenix, Arizona has a strong sustainability component. Once the expansion is complete, the facility will recharge up to 8 million U.S. gallons of treated effluent into the ground every day – enough water to serve an average of 24,000 single family homes annually.
This innovative project, in a distinctly drought-challenged area of the U.S., saw a major milestone reached ahead of schedule in early December 2021 when the expansion reached capacity to recharge 1.25 million gallons per day — a target that was not set to be hit until early 2022. Considering the facility was recharging 250,000 million gallons per day just one year earlier, this demonstrates the importance of keeping pace with one of the fastest growing areas of greater Phoenix.
To get a sense of what that growth looks like along this 36-mile corridor, major corporations have set up or expanded their operations. This includes the Red Bull processing facility — the only one of its kind outside of Europe — which began operations in 2020; a new White Claw brewing facility that started up in October of 2021; and a new Microsoft data processing centre. In addition, Nestlé has announced plans for a bottling and distribution centre, and two new industrial complexes have been developed, as well as communities for housing.
Based on projections from a municipal economic analysis in 2017, it’s anticipated that development of the Luke 303 corridor will create 21,000 jobs. And, as EPCOR continues its work to serve this growing area, we will maintain our goal of recycling at least 90% of the water we treat.
Learn how the Luke 303 Regional Water Reclamation Facility – in one of the fastest-growing areas of Greater Phoenix – is ensuring long-term water system reliability and fueling the economy.